Thursday, February 25, 2021

The 2021 TX Big Freeze: A Toxic Mix of Politics and Economics - Part 1

First, yes, I'm back again!!  I now have a 18 month old baby girl, so I'm a single dad so a little limited on time these days.  Nevertheless, having gone through 4 nights of freezing cold weather here in Corpus Christi, Texas, I feel the need to do some thinking about the power grid in Texas. 

Background

It is well documented that Texas has it's own power grid, and this power grid emanated out of a strong desire (similar to banking) to remain independent from Federal regulators.  The Texas grid is called the Texas Interconnection and it covers around 90% of the area of the State of Texas.  As you can see from the figure below (taken from the North American Reliability Corporation), there are only 2 energy grids on the continent that are smaller than the size of a State, notably Texas and Florida.  By being smaller than a State that means that as long as they don't trade energy across State borders they can escape being regulated by the Federal Energy Regulatory Commission, as only energy grids taking part in inter-state commerce are regulated at the Federal level.  The Texas Interconnection has gone to extraordinary lengths to ensure that even energy traded from the Western Interconnection to Mexico does not end up being traded to Texas (otherwise that would trigger Federal oversight).  A previous Governor of Texas, Rick Perry, even went as far as to say that Texas would rather be without power for more days than have Federal oversight of the Texas Interconnection (see here), but there are others who feel that this isolation (see here) may soon come to an end.  Indeed the Federal government does still have the jurisdiction to intervene if the State policies are a threat to the wellbeing of Texans.  

Now there are 2 other issues that in normal circumstances would have been mentioned as footnotes, if at all.  The first is the fact that the Texas Interconnection does have links to other States, but they are just not used. There was an incident in 1976 after a Texas utility, for reasons relating to its own regulatory needs, deliberately flipped a switch and sent power to Oklahoma for a few hours. This event, known as the "Midnight Connection," set off a major legal battle that could have brought Texas under the jurisdiction of federal regulators, but it was ultimately resolved in favor of continued Texan independence.  The fact is that Texas does already have 2 connections with the Eastern Interconnection, but apart from the "Midnight Connection" episode, these are not used (but are supposed to be available in case of an emergency).  The other issue is that there are 3 links to the Mexican energy grid, which are usually used for exporting energy rather than importing energy.  


ERCOT

The agency with responsibility for running the Texas Interconnection grid which is made up of private producers of energy of all different types, has been all over the news lately, and of course it is coming under great scrutiny ever since "The Big Freeze" occurred.  It's name, rather ironically, is the Energy Reliability Council of Texas (or ERCOT) and it is a non-profit based in Austin and in Taylor, Texas.  ERCOT is a non-profit with a Board of Directors of various stripes.  So let's go through their bona fides for this obviously important job:

  • Bill Magness is the CEO and has a law background and lives in Texas;
  • Sally Talberg (who lives in Michigan) is the Chair, who has a background in energy regulatory policy (and not in actually producing energy);
  • Peter Cramton (who lives in Germany/Maryland) is the Vice Chairman, and is a Professor of Economics at the University of Maryland and University of Cologne - he is a specialist in auction markets;
  • Vanessa Anesetti-Parra is a board member based with Just Energy which is based in Canada, but offers services in Texas;
  • Terry Bulger is a banking expert who lives in Illinois;
  • Mark Carpenter is an electric utility engineer based in Texas;
  • Lori Cobos is the head of the Texas Office of Public Utility Counsel and lives in Texas;
  • Raymond Hepper is a retired electric VP for the New England grid system, and it appears as though he lives in MA.  
  • DeAnn T. Walker is the Chair of the Public Utility Commission (PUC) of Texas [in an ex-officio capacity]

and most of the other appointees not listed here are representative of the various market segments on either the consumer or producer side of the market in Texas.  Now I believe several of these Board members have resigned, but what I am trying to address here is not exactly who is on the Board, but the makeup of the Board.  

Now if we look at the description of ERCOT and how it is regulated, their website (see here) quite clearly states that "ERCOT is a membership-based 501(c)(4) nonprofit corporation, governed by a board of directors and subject to oversight by the Public Utility Commission of Texas and the Texas Legislature."  So that means that the PUC is regulating ERCOT but the Chair of the PUC has a seat at the table of the ERCOT Board.  

 But let's just step back a minute and look at the composition of the Board of ERCOT.  It consists of many of the representatives of the customers and suppliers of energy in Texas, as well as the head of the regulatory body.  I would suggest that this is not a good governance structure for ERCOT for the following reasons:

  1. The PUC Chair is on the Board of the entity they are in charge of regulating;
  2. The ERCOT Board consists of individuals who have no direct relationship with Texas, and therefore no "skin in the game" in terms of ensuring that this Body works for the good of all Texans;
  3. The ERCOT Board consists of a large number of supplier and customer representatives, with differing incentives - the suppliers clearly want the highest prices for their output and the customers clearly want to pay the lowest amount for this output; and
  4.  On the ERCOT Board, coalitions of voting members who are also market participants can easily vote down regulations they do not like. 
The last point is particularly relevant to "winterizing", expenditure on processes and equipment that will allow energy generation and distribution in severe winter conditions.  If policies are proposed to mandate winterizing for example, the suppliers may not want to do it as they are not sure how much of it they can pass on to their customers, and also the cost of winterizing may be different for different energy generation methods, which will lead to uncertainty as to competitive advantage vs other forms of energy generation.  Similariy, the ERCOT customers (commercial and retail energy companies) may not want to do it either, as it will lead to higher prices, which will lead to less energy purchased, and may increase the attractiveness of natural gas and solar power as alternatives for residential customers.

The PUC

But the rules of the game and the regulation of the Texas Interconnection really falls to the regulators.  As the ERCOT website makes clear, it is the PUC and the Texas legislature that is responsible for oversight of ERCOT, and therefore those are the responsible bodies for dictating the rules under which ERCOT generates and supplies energy to Texas businesses and residents.  

So let's do a deep dive on the PUC now to see what is going on there.  There are 3 PUC commissioners, all of whom are appointed by the Governor and "serve at the pleasure of the Governor".  At present, as the PUC webiste shows (see here), these are:

  • DeAnn T. Walker who is the Chair, and has a background in accounting and law;
  • Arthur DeAndrea was General Counsel to Governor Abbott and has a background in law; and
  • Shelly Botkin who has an undergraduate degree in anthropology and used to work as the Director of Corporate Communications and Government Relations for ERCOT.
I do not know whether these 3 Commissioners are card-carrying Republicans, but I would suspect that if Governor Abbott appointed them (and at least one of them has worked in Governor Abbott's office) then there is a high probability that they are.  Moreover, one of the Commissioners was appointed from ERCOT which could give rise to "regulatory forebearance" ( - the notion that the regulator would go easy on the entities being regulated), and none of them have any direct expertise in the science and technology of power generation.  It also means that 2 out of the 3 Commissioners have a direct person to person relationship directly with ERCOT, and so it likely therefore means that ERCOT's views will be over-represented on the PUC.    

When you do a simple Google search on the Chair too, some worrying evidence comes to light - such as the article from July of 2020 in the Dallas Morning News (see here) regarding the disbanding of the PUC Enforcement Division.    

Now in terms of the grid standards that ERCOT has to comply with, these come from 3 bodies:
  • FERC - the Federal Energy Regulatory Commission
  • NERC - the North American Electric Reliability Commission
  • Texas RE - the Texas Reliability Entity (see here)
The first 2 bodies determine standards and protocols in the US and North America respectively, but as Texas doesn't wants to be independent of the Federal government in terms of everyday activities and supervision, it has created it's own regulatory standards body, the Texas Reliability Entity or Texas RE.

Texas RE

Texas RE is once again a non-profit with a board of directors consisting of 8 individuals.  There is a mix of lawyers and energy executives or past executives, and from the Texas RE website.  This body was likely ultimately responsible for the regulation of ERCOT to certain specified standards that would have to be maintained by ERCOT, but in fact this body had already been fired by the PUC in September 2020, with no replacement made by the PUC.  This is documented here in a Houston Chronicle article.  Of course it is even worse than this, as the Texas RE may have been completely inadequate as supervisor and enforcer of standards for the grid, but I have not managed to find any documentation on this issue, and in any case, the Texas RE no longer has any function in relation to the Texas grid.

Toxic Politics and Economics
 
What is clear from my digging into the regulatory framework for the Texas Interconnection, is that Governor Abbott had failed to act when the PUC fired the Texas RE as monitor enforcers and supervisors of the power grid - they still exist, but their role as I understand it is now just as a supplier of information and a central despository for self-reported violations.  

The economic part of this is that any winterizing that needed to be done was likely not done by the grid participants as they knew that there would be no inspections or enforcement (with fines).  Worse than that, Governor Abbott must have known what was going on at the PUC, and yet he did not act, given that all the PUC commissioners serve "at the pleasure of the Governor".  

Summing Up So Far

In terms of the regulatory structure of the Texas Interconnection, there are 4 potential problems that I have identified:
  1. The potential for "coalition building" on the Board of ERCOT to resist doing things that raise costs and therefore prices;
  2. The Regulator having a seat on the Board of the representative body of the Regulated entities;
  3. The Governor's appointment of Commissioners of the regulator (the PUC), which has led to less than ideally-qualified individuals regulating ERCOT; and 
  4. The fact that 2 of the 3 PUC Commissioners have direct current or past dealings with ERCOT, likely leading to "regulatory forebearance.
  5. The actual enforcements of standards was up until last year the responsibility of Texas RE, but they were fired by PUC, with no replacement being made - leaving the field completely open to forgo winterization this year.


Sunday, March 22, 2020

The OPECoronacession is here

In an attempt to respond to the requests for my views on what is going on with the US  macroeconomy in particular right now, but also in general for the world economy, I have decided to come out of enforced hibernation and put fingertip to keyboard. We certainly live in interesting times, and although we were definitely due a recession, as usual the source of the recession was somewhat of a surprise.

To preview what the basic message is in this blog posting, if anyone is in any doubt that a global recession is occurring, I think you have to study the rather disconcerting facts about the economic impact of both OPEC and this virus, and then even without any statistics it becomes quite obvious that for both the US and UK, and many other parts of the world, a deep recession is now underway.  Quite why the US Treasury Secretary, Steven Mnuchin (see here), thought that the US would avoid a recession, is beyond me.  Some think his forecast was made to keep up morale, but I think that in fact it undermines the credibility of the position of the Treasury Secretary.  I would also note here that soon afterwards, the Treasury Secretary appears to have reversed his views, noting that the US economy could very soon experience an unemployment rate of 20%.

The Corona virus along side human cells
In this blog post, therefore, I want to review what I think could be the economic impacts, and then give my take on what should be done from an economic perspective.

Before we start though, let's get some definitional things sorted out.  First, this is a real "shock" in the proper sense of the word.  Economists use this word "shock" to mean any development or change in conditions that impacts the economy, but it is usually from some kind of change in human behavior or asset bubble.  To be honest I don't think of these changes as "shocks" per se, as they are not really sudden changes that are impacting the economic system, but are rather what I would call a "development" or change in the economic environment.  The OPEC change in policy with regards to oil quotas is a good example of this - there is a change in one sector which ricochets through the economy.  The corona virus, however, is not like just a change in the behavior of certain market participants or an industry with knock on effects; this is a real "shock" in the sense of a wholesale change in economic circumstances with everyone having to adapt to a sudden new environment, with some sectors of the economy closing down entirely, and others seeing booming conditions.

Secondly, the question as to whether this is a supply shock or a demand shock - our macroeconomics is really inadequate in describing what is going on right now, as clearly we have both supply and demand side effects happening, so although I see economists arguing that this is a supply shock rather than a demand shock, this distinction is irrelevant as what we have is a contractionary economic event, both on the supply and demand sides of the economy.  And this also means that the usual textbook monetary policy channel responses are unlikely to help much in stimulating the economy, as both investment and consumer spending is really not dependent on interest rates, and spending opportunities are now quite limited.

Next we need to think about the steps with which this recession is being brought on, and in my own opinion how it might play out.  So first the corona virus rears it's ugly head in China and causes supply problems for US firms due to the fallout in the Chinese economy - oh and incidentally the Chinese economic numbers released last night ( - see here) showed factory output falling by 13.5% during January and February compared with the previous year.  And in addition to statistics on factory output the retail sales figures were down 20% and investment figures were down 25% compared with a year ago.  Now remember here too, that China, as it is a communist country, had a centralized response to the virus, and only locked down one Chinese province (Hubei Province), and so contained the spread.  So just imagine if the virus had caused a complete lockdown of the entire country - and yes, that means that these figures would have been even worse.  Indeed although the Chinese claim to be over the virus and almost fully recovered, this seems quite suspicious to me, and I understand from my contacts in that country that there are still cases arising, but everyone now takes appropriate precautions.

The virus has spread to Europe next, with whole countries on lockdown, with whole swathes of their economies' ground to a halt.  That will surely mean even steeper falls in output in countries like Italy and now France and Germany.  The virus is now definitely spreading in North America too, and that has caused some draconian measures which (as it is now doing in Europe) will cause a collapse in output in certain industries ( - think cruises, tourism and the travel industry, consumer discretionary spending, entertainment and the housing industry). 

The second catalyst for recession in the case of the US is the collapse of the OPEC meeting on March 8th (see here), which caused Saudi Arabia to increase output massively, prompting oil prices to collapse to roughly half of where they were before the OPEC meeting.  This collapse in oil prices, while being good for consumers ( - the US President referred to it as having the same effect as a tax cut), is a real blow to the US fracking industry if these low oil prices persist for any period of time.  Why is this?  Well most fracking wells are not profitable at prices below roughly $40 a barrel, so with prices now down at $22.63, nearly all of the US fracking oil companies will be losing money.  What's more, many of them had bought substantial tracts of land in the heady days when oil was over $100 a barrel, and had borrowed heavily to do so.  So many of these companies are heavily indebted and are unlikely to be able to survive long at these current oil prices - in fact recent reports show that they are already laying off thousands of workers (see here).

The Corona Virus exiting a human cell
So what is happening now with the spread of the virus in North America is that the workers in the oil, transportation, entertainment, tourism and consumer discretionary are being laid off, and hence unemployment is undoubtedly rising, and probably much faster than we realize.  In most locations in the US all bars, clubs, cinemas and restaurants are closed, and in other cities measures are even more draconian.

To gauge the percentage of US GDP that we are talking about here, let us look at US output by sector for 2018 ( - this still hasn't been completed for 2019). For all industries we saw an increase of 6.1% in 2018 over 2017, but of course this is in nominal amounts, so adjusting for inflation, we have to subtract inflation which in 2018 was about 2.3%, which gives us a real output increase of roughly 3.8%, which is obviously a little higher than the 3% real GDP estimate from the BEA due to the fact that GDP subtracts out the items that are intermediate goods ( - goods which are used in the production of something else).
So running down this table we can see that the industries that are at risk are on lines 4, 11, 12, 16 and 24. Now let's make some back of the envelope assumptions and say that we have a similar situation as in 2018 in terms of output amounts.  Let's also assume that we are looking at the first quarter of 2020, so we are only talking about one month out of the whole quarter being subject to this shock.  So let's do some very rough and approximate calculations for the last month (March).

First, mining (which is mostly oil and gas) gets cut in half (-$250m in 2018), retail trade slows by about 25% (-$465.73), transportation and warehousing falls by 25% (-$316.50m), real estate also takes a hit of around 25% (-$1000m) and lastly arts and entertainment and accommodation get cut in half (-$750m).  Note that this does not include any multiplier effects or "knock-on" effects (to other industries) and nor does it include the likely increase in the output of the healthcare sector due to hospital stays.

https://www.bea.gov/system/files/2020-01/gdpind319.pdf Table 8

So when looking at the change in output from 2017 to 2018 this went up by 6.01% in nominal terms. Now if we take off the conservative estimates of the fall in output that would have occurred if the Corona virus had hit the US during that year, we get $2,781m which when subtracted from the 2018 total would give us $33,812.3.  But recall in the first quarter that only the month of March would likely see this fall, so then that gives us about a fall of around $930m.  When you do the calculations as to the nominal growth rate you get about 3.4% which when adjusted for inflation comes out to be roughly 1%, but then taking out the intermediate goods this will bring us down to roughly a stagnant economy with real growth of around 0% in the first quarter.  So my forecast for GDP growth in Q1 is 0% or somewhere close to this.

The 2nd quarter will likely be much worse than the 1st quarter though, and while I don't wish to speculate how bad it will be ( - Goldman Sachs already is forecasting a 24% fall in real GDP), it will definitely put us in recession territory given that it goes on beyond 2 weeks.  But once again let's do a "back of the envelope" extremely rough calculation.  One of the reasons I did not include the multiplier effects for Q1 is that they take time to filter through.  If we assume that this corona virus and OPEC situation persists for the whole of Q2 and that we have a 1.4 multiplier effect on the fall in output then we get approximately $4,000m which then make our change in nominal output -5.5%, but then taking off the inflation rate to get a real rate of growth we end up with -8%, which then taking off roughly another 1% to adjust for intermediate goods gets us to roughly a -10% year over year growth rate.  I would also add that this is also a conservative estimate as it assumes no "knock on" effects so only a limited impact on the sectors of the economy not accounted for above.

Exactly what might be the impact on unemployment of this fall in real GDP growth?  Just to illustrate, according to Okun's law (which is the relationship between unemployment and economic growth, if we see economic growth fall by a total of 13% (the difference between 3% (for last year) and an estimate of Q2 growth of say -10%, that means that (if Okun's law prevails) the unemployment rate would increase by 6.5% from its current level of around 3.5% to 10%, which is the level it reached during the great recession.

Obviously you can do further math which could show things deteriorating much further, but I think you get the picture - at the minimum we are looking at a really sharp recession that, macroeconomically speaking, is at least as bad as the "great recession" of 2008 to 2009, with the likelihood that it could be much worse if this worsens throughout Q2.  Of course if things improve and the viral spread is brought under control quickly as it appears to have been the case in China, then these scenarios brighten considerably. 

Now let's look at the policy responses.

On the monetary side, the Fed has been busy pumping money into the economy by resurrecting some of the tools that it used during the "great recession".  These are summed up here, and they should have the desired effect of safeguarding solvent financial institutions from the negative impact of the corona virus and the fallout from the latest OPEC meeting.  This is important as it provides for lines of credit by financial institutions (such as banks) to their clients, and makes sure that the banks have virtually unlimited funding (from the Fed) to supply this assistance.  Obviously this applies to solvent companies, as even with unlimited backing, few banks are going to want to provide credit to technically insolvent companies. 

Given that both the OPEC and corona virus impacts are not really financial in nature though, but rather are a matter of providing funds to provide a social safety net and to assist industries that are heavily impacted, the burden of response must fall on fiscal policy.  So, on the fiscal side, it is clear that both individuals that are impacted need assistance, and also industries that are impacted might also need and request some kind of government support.  As of writing, the proposals coming out of Congress are essentially "helicopter money", with checks for households, and loans and grants to various industries.  But what is apparent to me is that the government has not seemed to grasp the impact of the quarantining and closing up of businesses that necessitate social interaction, not only on the workers, but also on the firms within the industries.  At the same time, it does seem to me to be incumbent upon the government to learn lessons both from previous recessions and from, for example, the Japanese experience with deflation.  I understand that it is extremely difficult to design a fiscal stimulus package that will address an evolving situation, and obviously anything that Congress passes and which the President signs may have to be tweaked later.  Nevertheless it seems to me that fiscal policy should:

a) provide immediate relief to those suffering hardship from being laid off or from lack of business if self-employed; and
b) provide support for industries that are incapacitated or have severe falloff in customers due to social distancing.

Although the current thinking for a) is that unemployment insurance and 2 checks, proposed by the current Treasury Secretary should be the first step, this is perhaps not the best way to provide assistance, as certainly the checks will not be targeted and will just be presumably to all taxpayers, regardless of income or job security.  Plus one of the problems in just writing a check to citizens is that presumably a secondary important reason for doing so is to stimulate the macroeconomy.  I would suggest that probably a better way of doing this is to provide a debit card to all citizens which would also have an expiration date - that way there would be more certainty that the money is injected into the economy through new spending.  This money could be paid back through paying higher taxes for up to 5 years. Of course some individuals might still claim a debit card only to substitute that debit card spending for their own spending, but I would suggest that this is a better way than just giving individuals a check.

As for support for industries, I would not favor grants, which are one of the current preferred methods of support by the administration.  I would favor small companies receiving loans with low interest rates, and larger companies that are in financial trouble having the ability to issue shares which the government would then purchase (as a secondary issuance).  The cash that companies raise from selling partial ownership to the government would not be permitted to be spent on either share purchases from private citizens or on dividends or increased remuneration of  management.  The idea here is to give support where needed, but at the same time for the taxpayers money to be used in ways such that there is a return on the investment that the government makes in these struggling companies.  And these facilities should not carry a fixed sum, but rather, should be a facility that any company in trouble can tap if required. Of course some of these companies will fail, but at least the government would not be supporting one industry at the expense of another, and would also have a broad portfolio of loans and shares which if properly diversified should yield a decent return for the taxpayer and not end up costing the government a dime.

As Winston Churchill once said: "Never let a good crisis go to waste" and what I fear right now is that our policymakers just do not seem to have the imagination to come up with some new ways of thinking about how to support the macroeconomy without increasing the national debt by an extremely large amount in the long run. 


Saturday, September 15, 2018

The Macroeconomics of Trump's Trade Policy and Portfolio Implications

One of my ex-students, who is now working for a prestigious Financial Services sector company, contacted me to ask me about the US$ and tariffs and if there was any relationship between the two.

Why is this important?  Well it is important for several reasons, perhaps most notably because the effects of a higher dollar actually appear to work against the objective of the Trump adminstration's trade policies of reducing trade imbalances between the US and the rest of the world.  How is this the case?  Well a higher dollar means that our exports appear more expensive to foreigners, but our imports then appear cheaper to domestic residents.  So in fact (depending on price elasticities and what is called the Marshall Lerner condition), our exports could fall and our imports increase, which everything else remaining constant would worsen the trade deficit.

But any student of economics who has completed an intermediate macroeconomics course actually knows that there is a more fundamental macroeconomic link between trade policy and the exchange rate, which is presented in perhaps its most simplistic form in Greg Mankiw's Intermediate Macroeconomics textbook (see Chapter 6).  So let's deal with the hard stuff first and tackle the macro theory.  To those of you who are more "wonkish" out there, this is known as the Mundell Fleming model, which got its name from the two Canadian economists who originally constructed the model.

The idea of the chart is that there are 2 relationships which govern our external sector.  The first is that our real exchange rate is related to our trade balance, and that relationship is embodied by the downward sloping curve labelled NX. The second is that our Balance of Payments must balance.  This means that whatever happens on the current account, which can be mostly represented by our trade balance Net Exports = (Exports - Imports), must be matched by what happens on our Financial account, which is determined by the imbalance between our savings and our investment.  So all the vertical line says is that if we have a given level of Savings (the funds available to firms) and Investment (the amount that firms need to fund their investment expenditure), then that means that this must be the amount that is made available through money flows in or out of the country.  In this simplified setup, this is not dependent on the exchange rate.  So in equilibrium we should be where the 2 blue lines cross, so where the current account and the financial account of the Balance of Payments match with opposite signs (so that their sum is zero and hence we are in balance - a constraint that every country has to satisfy).

So what happens when we have a change in trade policy, which is essentially what has happened with the Trump administration's imposition of tariffs and threat of imposition of tariffs ( - as financial markets react in terms of expectations of future events)?

As you can see from the diagram from Mankiw's textbook, the theoretical implication is that imports fall as one would expect, but that leads to an imbalance on the Balance of Payments, so the exchange rate will appreciate, which in turn will choke off exports and stimulate imports, which ultimately leads us back to the same level of net exports.  

President Trump is causing the US$ to appreciate simply because of his tariff talk and in some instances his tariff actions.  So the flow of causation definitely runs from the threat of imposing large tariffs on our  trading partners through to currency appreciation.  And why is he doing this?  Because his main objective is to improve the US trade imbalance.  Economic theory suggests, however, that this is completely futile, as all it does is appreciate our currency and leave our trade balance at roughly the same level.

But of course this is just theory, and it relies on a raft of unrealistic assumptions.  So can we glean something from the actual data?  Below I have plotted real Net Exports of Goods and Services vs the Trade Weighted US dollar on the same graph, to give you an idea of how these two variables move over time.  [And for those of you who say I should be using the real exchange rate (RER), the RER essentially follows almost exactly the same path as the nominal trade weighted version]. 

Clearly sometimes the currency and Net Exports move together, as during the "great recession" and sometimes they move in different directions, as they have done in recent years.  Clearly it largely depends on what is causing the change in Net Exports, as this variable is the net result of a complex combination of different factors.  Nevertheless, the sharp move upwards in the real value of the US dollar in 2015 through the beginning of 2016 has definitely been reflected by a deterioration in the Real Net Exports of goods of services.  What is also clear here is that there has been a jolting rebound upwards in the exchange rate since President Trump took office, which will likely be reflected in little improvement in the Real Trade Balance of goods and services for the next while.

Now let's move beyond the economics here, and think about the implications for the valuation of financial assets outside of the US.  I listen regularly to CNBC and there has been a lot of talk there about how emerging markets have not performed well so far this year and whether there is any likelihood of a rebound.  Obviously a strong US dollar makes for foreign stocks of any type to look cheap in comparison to US stocks, and given the cyclical nature of movements in the US dollar, over the long haul it makes sense to accumulate (good) foreign stocks when the dollar is strong so that when the dollar weakens you enhance your returns by getting a double whammy return (from the stock and also from the gain in the foreign currency against the US dollar).  That is one reason why, when you look at the chart above, emerging markets did very well last year as the US dollar weakening gave an extra boost to foreign stocks.

So while we have an exceptionally strong dollar as we do now, I think it is actually sensible to start accumulating good foreign stocks ( - not necessarily in emerging markets incidentally), and preferably ones that pay a secure and decent dividend so as to pay you while you wait for US dollar to do a reversal.  If you have to go for an emerging market, I still suggest that India is the brightest spot right now, mostly because it still has huge potential from a growth perspective, but also because it is not in the cross-hairs of the Trump administration's trade policies.

Lastly, the next obvious question to ask is what might cause the US dollar to initiate a depreciating trend again.  My first answer would obviously be some satisfactory resolution on the trade issues confronting the global economy right now.  That might entail some brokered compromise or it might entail some other event that diverts the Trump administration away from its focus on trade issues.  

Sunday, April 1, 2018

The bell tolls on NAFTA - so what are the "known unknowns"?

Donald Rumsfeld
Donald Rumsfeld, the U.S. defense secretary in the George W. Bush administration, once stated (back in February 2002) that "there are known knowns; there are things we know we know. We also know there are known unknowns; that is to say we know there are some things we do not know".  At present, the situation with whether NAFTA (North American Free Trade Agreement) exists this time next year is one of these "known unknowns".  In fact the date for deciding whether NAFTA will exist next year is about a month away, due to mid-term elections north of the border and the Presidential elections south of the border, which will hamper any further progress in the negotiations beyond May.  Not only that, but some decisions are to be taken also before May on the extent of the tariffs to be taken against China, in addition to the ones already announced.

Larry Kudlow - Speaking at CPAC 2015
With the new tariffs on steel and aluminium, plus the resignation of Gary Cohn as the head of the National Economic Council and President Trump's top economic adviser, there is little now to stop the advance of US economic nationalism in the US administration.  Even the new appointment of Larry Kudlow as Cohn's replacement is unlikely to change things on the trade front, as Kudlow clearly sees the bigger picture and wants to keep his new appointment and much greater political influence than he has pontificating on CNBC.  Plus in the grand scheme of things these tariffs are not that important compared to the regulatory rollback favored by Kudlow and his ilk.

In general though, the US media seems to be at a loss to understand why President Trump is pushing ahead with this agenda, and is predicting doom and gloom with the potential for trade wars to emerge, rolling back the advances made towards a fully globalized trading system.  But they do not seem to understand what is at stake here, and nor do they seem to understand the economics surrounding globalization and how financial markets are to a certain extent tied to the fate of globalization over the next month or so.  The way I tended to view the President's stance on tariffs was that it was mostly a case of "bluster" to prompt other countries to yield on their trade positions so as to obviate the need to implement tariffs. But recent events have proved that position to be wrong - President Trump is indeed willing to bypass the WTO, and implement tariffs, particularly on China (there is a good article on the growing irrelevance of the WTO from the FT here)

But the President's position on NAFTA is a little different.  President Trump was partially elected on his campaign promise to either repeal or renegotiate NAFTA, and so far the re-negotiation has been hung up on various of the US demands, most notably: i) rules of origin for autos - 85% NAFTA and 50% US for those autos sold in the US; ii) scrapping of the investor-state system, where investors from another NAFTA country can sue the government of that country if they are treated differently from how they would be treated in their own country; iii) scrapping of the trade dispute settlement mechanism whereby a panel of experts decides which country wins a particular trade dispute case; iv) an end to Canada's agricultural supply management system; v) the introduction of a sunset clause whereby all 3 countries have to renew NAFTA every 5 years.

So what is likely to happen here and what are the potential "known unknowns" here?  First, how far is President Trump likely to want to compromise to save NAFTA. Well so far the negotiations have been making slow progress, but as one might imagine, some of the US demands are proving difficult for the other NAFTA countries to accept and/or compromise around.  The investor-state system has been updated, and as the US wants it scrapped, Canada and Mexico have decided to just make it apply to them, effectively giving the US an opt out from the system.  Recent news from the talks in Mexico City appear to show that the US has now dropped all it's demands on auto content (see here), which was also a major sticking point.  While that seems like a reasonable compromise, there are still other issues like the trade dispute mechanism and the sunset clause, where it is hard to see how the different parties can come together in a deal, despite what is at stake.
The Mexican border at Yuma, AZ

As the President stated in a Reuters interview last year: "A lot of people are going to be unhappy if I terminate NAFTA. A lot of people don't realize how good it would be to terminate NAFTA because the way you're going to make the best deal is to terminate NAFTA. But people would like to see me not do that". The big problem for President Trump is not Canada, although the Canadians have taken issue with the US position here (see this recent article in their national newspaper, The Globe and Mail here), but  on the other hand Mexico is seemingly the biggest problem as far as President Trump is concerned, and largely because of the trade deficit that the U.S. runs with Mexico . Even just this morning on his way to Church, the President stopped by reporters to announce that as well as there being no DACA deal that he was still considering pulling out of NAFTA (see here) if border security did not improve. So this is clearly a huge "known unknown", and if President Trump appears not to be able to get his cherished wall on the Mexican border by a deal with the Democrats on DACA, then this appears to be the President's next best hope - allowing Mexico to remain in NAFTA, only if it pays (in part or wholly) for the new border wall.  It also perhaps is a signal that the President was not happy with the concession that his negotiators made in regard to the trade in autos.

U.S. Trade Representative Lighthizer's comments at the conclusion to the 7th round of talks in Mexico City were also revealing. He stated "As President Trump has said, we hope for a successful completion of these talks, and we would prefer a three-way, tripartite agreement. If that proves impossible, we are prepared to move on a bilateral basis, if agreement can be made."

Texas is very much involved now in trying to save NAFTA - as Canada's Financial Post pointed out in an article this week (see here), but clearly the President is not keen to compromise on NAFTA without there being some quid pro quo in the case of Mexico.

But what is at stake is probably bigger than any talk of tariffs with China, as although China is a large trading partner, the embedded nature of the trading relationships with both Mexico are far reaching. The actual size of the trading relationship with both Canada and Mexico can be seen in the figure above, which shows the flows of trade in and out of the country for 2016,  Now of course the trade relationship with Canada is unlikely to be threatened, as President Trump will likely revert to what was known previously as CUFTA (the Canada-US Free Trade Agreement), but for US States along the border with Mexico the implications are much more serious if Mexico is prohibited from continuing in NAFTA.  The figure below shows the exports by State to Mexico and it is clear that although all the border States would be hit by any new trade restrictions introduced between the US and Mexico, it is Texas that would suffer by far the most of any State.
Now it is likely that the US has a surplus on services which should likely redress some of the imbalance on the trade in goods (i.e. a trade deficit).  The latest figures we have for the U.S. Services exports were $33.3 billion; services imports of $26.3 billion, giving a U.S. services trade surplus with Mexico of $7.0 billion in 2017.  This figure also seems small to me, considering how many Mexicans come on vacation to the U.S. and also considering the dominance of the internet by U.S. multinationals, but in any case, those benefits would likely mostly flow to one U.S. State: California.

So what are the possible outcomes here?
i) First the worst scenario, with a complete withdrawal from NAFTA. No special trade relations with either Mexico or Canada.  This is now extremely unlikely, but the effects on the North American markets would definitely be highly negative if it were to occur.
ii) Second, a more likely scenario would be a withdrawal from NAFTA while at the same time an invitation to Canada to continue negotiating on a CUFTA deal.  This I think is highly likely if no concessions are made by Mexico regarding border security, and in particular, some funding for the wall. Clearly Mexican markets would take a big hit if this were to occur, and the Texan economy in particular could potentially be badly hit. In the U.S., the auto sector and the energy sector would be particularly vulnerable.
iii) Third, another possible scenario which has just appeared due to the President's retreat from doing a DACA deal with Democrats, that of the NAFTA being successfully concluded due to a side deal that the President does with the Mexicans such that they partially agree to some unspecified payments so that the President gets a partial victory.  Although unlikely, due to Mexican opposition to any acquiescence on the wall, it is possible and would likely have no effect on the U.S. markets but would see a relief rally in Canadian and Mexican stockmarkets.
iv) Fourth, a successful conclusion to NAFTA without any side agreement, but with some of President Trump's signature demands embedded into the agreement, notably reformed dispute settlement mechanism and a sunset clause on the agreement, subject to a review and further revisions at some point in the future.  A relief rally in all 3 participant countries would likely occur on such news.

If I were forced to choose, I would say that outcome ii) and iv) are most likely, but in fact I think for electoral reasons I think President Trump's instincts will be to withdraw from NAFTA, unless certain key concessions are won.  . 

Wednesday, January 10, 2018

Happy New Year for 2018!! Economic outlook and investment strategy

Happy New Year to all my Econoblog readers, and readers through the syndication to Seeking Alpha. As usual, I will try and distill my "top down" macro views for prospects for 2018 in terms of economic growth, the stockmarket, and interest rates.

Backdrop

As we enter the 10th year since the last downturn, the global economy is living on borrowed time - and I mean that literally!  As I explored in my last Econoblog posting (see here), the business cycle is elongating, for either temporary or permanent reasons.  My own predilection is for a permanent elongation (mostly due to the findings from my own academic research agenda), but either way, an elongation is now occurring for this phase of the business cycle as we move into 2018.

So the real question is what will perform best as we move into the late stages of the business cycle expansion, and how to hedge the uncertainty of the coming downturn whenever it is. Well there are several different approaches one can take to answering this question, so I will first do a review of what I see are the prospects for the different regions of the world, and then focus in on what I think makes sense for my own investment strategy.

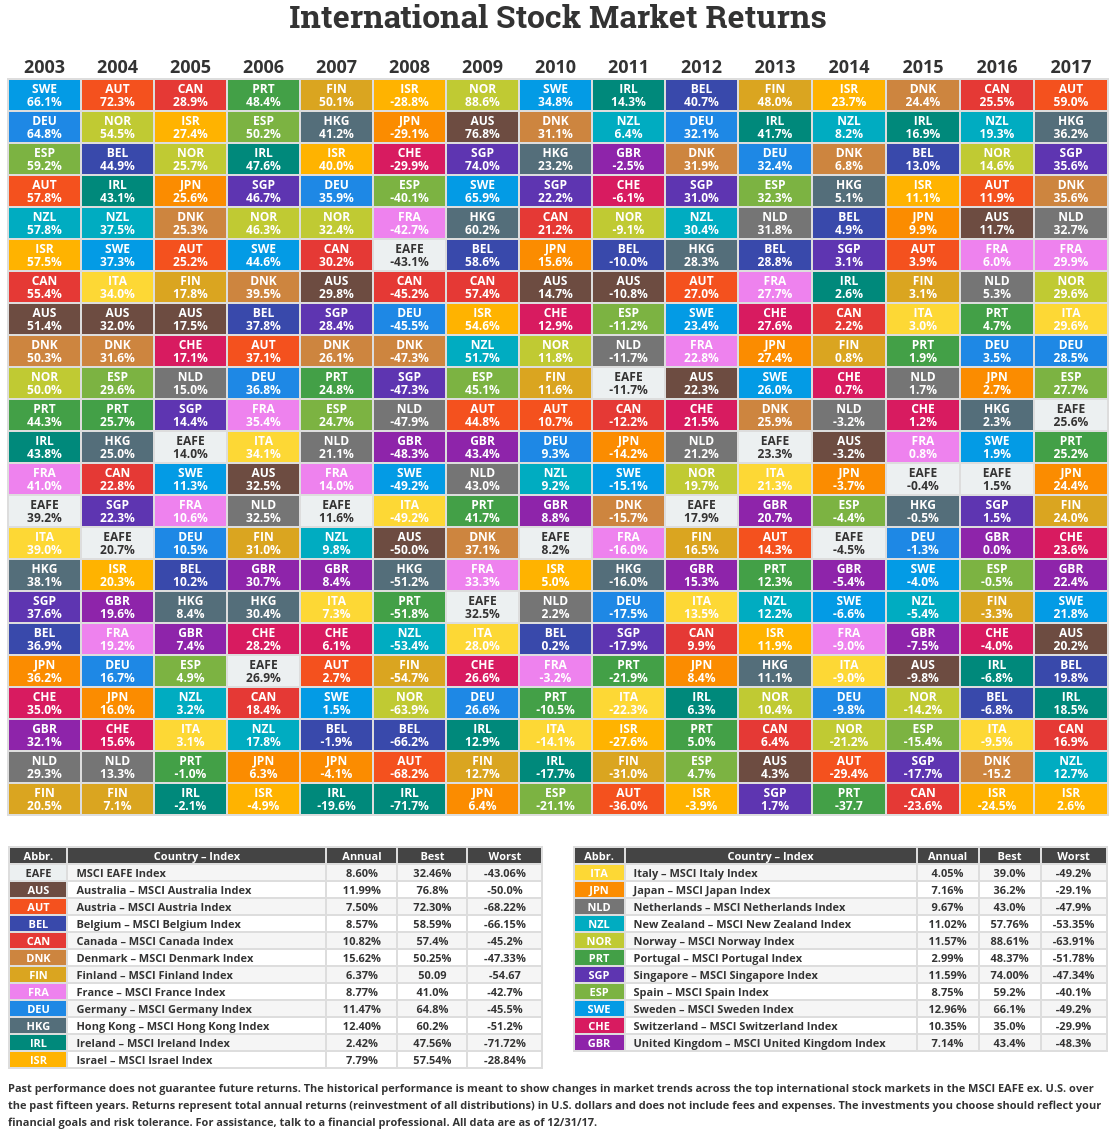
A quick aside. 2017 has been an exceptional year in the stockmarkets, and the performance of the major stockmarkets in the world has been positive almost everywhere. In the US, the S&P 500 was up 19.4%, the DJIA up 25.1% and the Nasdaq up an astounding 28.2%, while the 10 year US government bond yield is still under 3%.  But although the US performed well, many other countries outperformed the US.  The chart below shows the return of different stockmarkets (in US$ terms), and if we use the S&P 500 as probably the best overall barometer for the entire US stockmarkets, then the US is near the bottom of the list in terms of performance for 2017.

Novel Investor International Markets Returns Table
Source: Novel Investor

But this also doesn't consider other classes of assets, and the website Novel Investor once again has this covered with a chart that shows that emerging market stockmarkets outperformed all other classes of stocks.  This is due to the fact that emerging market stockmarkets have had a fairly tepid performance throughout this business cycle upswing, so in the late stages of the upswing in growth, obviously this will boost commodity prices for many things, which will allow emerging market stockmarkets to outperform.

Novel Investor Asset Class Returns TableSource: Novel Investor

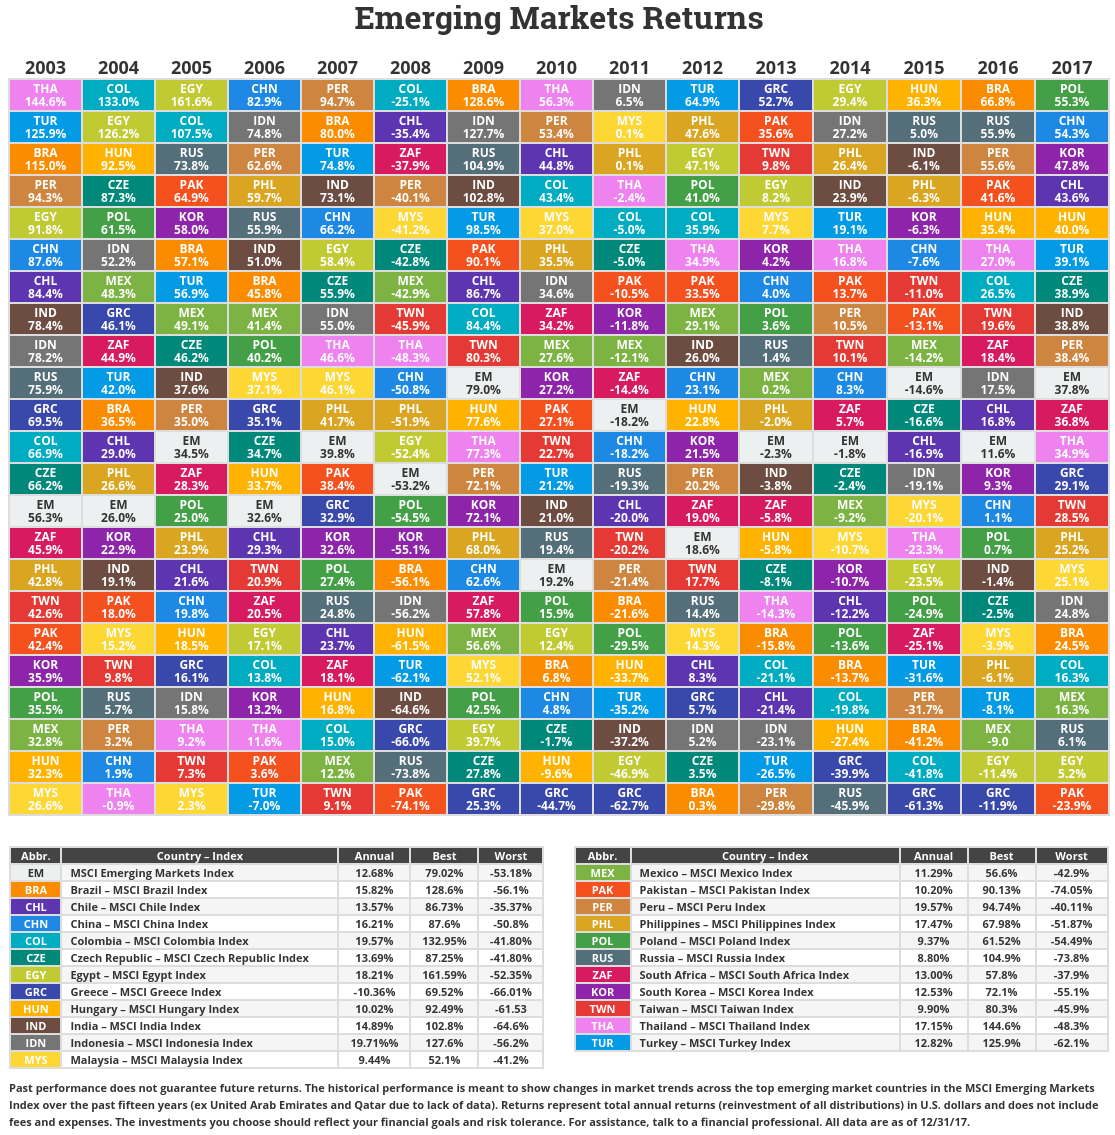
But what of individual emerging markets?  Where performed the best?  Well once again, Novel investor has us covered here too.

Novel Investor Asset Class Returns Table

Source: NovelInvestor.com

So Poland, China, South Korea and Hungary were the big winners for 2017.  And Pakistan, which several commentators said would perform very well in 2017, was the big loser.  And that really highlights a problem with emerging market economies and individual emerging markets - they are very volatile and it is really a fools game trying to pick which market will be the winner in any particular year.  But there again, that's why anyone interested in investing in emerging markets would be wise to buy an emerging market mutual fund rather than stocks in any individual country.

Back to my thoughts about 2018.  So with the backdrop of the current phase of the business cycle and the fact that US interest rates are likely to rise in 2018, let's look at each region in turn and then devise an economic outlook and investment position for 2018.

North America


The US has had a great run in 2017, but with rising rates, and an erratic President, with the good news for US corporations now delivered in terms of the tax reform, further progress with President Trump's agenda will be difficult.  The President will need cooperation from democrats if he is to pursue his plans to pass an infrastructure spending package, and the impasse on immigration doesn't seem to bode well for cooperation in that or in any other area for that matter.  So I can only conclude that most of the good news for stocks has already now been achieved, and there will be little more coming down the pipeline.  If there is more and I am wrong, then clearly the infrastructure and construction companies will do well.  Given the political uncertainty in the US surrounding the mid-term elections and the ongoing investigations together with rising interest rates and withdrawal of QE, I think the US will underperform compared to other parts of the developed world and certainly with respect to the emerging markets.

I think NAFTA will likely collapse in 2018, which will mean that Mexico is probably not a stable place to invest, but Canada will likely outperform both the US and Mexico, given that the US has made it clear that if NAFTA is terminated, then the US would still be open to falling back to the original CUFTA trade deal that was the precursor to NAFTA.  So in general, I think that Canadian stocks are a safer bet than US stocks for 2018 and should be bought on any signs of weakness.

The other factor that has had very little press so far this year is that yes, we have a new Chair of the Fed, Jay Powell.  As with all Fed Chairs, Jay is likely to have an early stumble or mishap in the job as he finds his feet.  That may unnerve the markets as well.  I would expect that maybe the FOMC might act too aggressively to increase rates than is necessary, or may "fall behind the curve" at some point.  Either way, there are clearly consequences for the stockmarkets here.

The US dollar is also a bit of a conundrum for 2018.  Rising interest rates usually portend a stronger currency, and that's what we have seen so far but with the protectionism proposed by the Trump administration and the possibility that the Chinese may no longer buy so many bonds, that in turn will have an uncertain effect on the currency.  As can be seen from the plot of the trade weighted US dollar, despite the recent depreciation, we are close to all time highs already.  Obviously from international economics that means that the markets have already discounted further rate rises, and are perhaps now looking for reasons not to push the US currency any higher.


Europe

European stockmarkets generally had a great year in 2017, and as QE continues in 2018, it is likely that this will continue at least until the second half of the year.  If you look at the performance of the European stockmarkets in recent years, they nearly all had downturns in 2014 and/or 2015, so they are basically still catching up with the US, and of course the banking sectors in the EU are still fragile but improving as time goes on.  The Mifid2 directive, which was supposed to come into force at the beginning of this year will likely (when implemented in March) increase transparency and efficiency in EU stockmarkets which will tend to increase confidence and spur greater stockmarket returns.

The two areas where there are significant risks are Brexit and Greece.  With Brexit, there is no certainty yet that a trade deal between the UK and the EU will be achieved before the exit date of March 2019.  Although Prime Minister Theresa May has successfully concluded the conditions of the breakup by agreeing to a hefty payment to the EU and safeguarding the right of EU nationals to remain in the UK after March 2019, this does not ensure that a trade deal will be struck in time.  The current policy of "gradual divergence" (see here) does not bode well for a consensus on any new trade deal as the EU does not see this as consistent with having a trade deal that would create a level playing field between the UK and the EU - it is seen as cherry-picking the areas where the UK would not want to diverge for fear of losing business, while having the right to diverge in other areas.  Also the Chancellor, Philip Hammond, who is much more in favor of a "soft" Brexit, has broached the idea of a new customs union with the EU (see here), but this would not allow the UK much independence when negotiating trade deals with other countries as the UK's hands would already be tied in relation to trade policy because of the EU customs union.   The second area of risk remains Greece.  Greece is now experiencing growth again, but the political situation is still not completely stable, as an elections must be called by October 2019, and the current government is unlikely to want to wait that long, so a general election is likely to be called in the second quarter of 2018.  The outcome of the election is likely to determine whether Greece continues to follow the path of fiscal consolidation insisted upon the rest of the EU, or a new government pushes the country in a different direction.

From an investment standpoint probably the Nordic countries are most insulated from these risks, although probably Central and Eastern Europe stockmarkets are still likely to be the most volatile and may yet again outperform the Western and Southern European member states.

Japan

The news from Japan has basically been good in 2017.  The efforts to stimulate the economy using QE appear to be now paying off, with economic growth now positive for the 7th consecutive quarter (see here), but mostly due to external factors rather than domestic growth ( - consumption was still in decline in the last quarter reported).  Nevertheless recent revisions to 3rd quarter GDP suggest that the economy was growing faster than previously thought, which allowed the stockmarket to remain buoyant, but it does mean that without the external demand stimulus and the continuing QE, the economy would likely have experienced only tepid growth.

The Japanese economy therefore does appear to have achieved "escape velocity" which means that deflation is now in the rear view mirror, despite the fact that inflation is still falling short of the Bank of Japan's inflation targets.  This should allow the Japanese stockmarket to make further gains in 2018.  In fact, if correct, a recent FT article (see here) suggests that the labor market is now in a state of severe shortage, which should allow wages to start to rise in a more sustained.  That, in turn, will boost the stockmarket.

Rest of Asia

My views on China are relatively well known after my recent presentation on OBOR (One Belt One Road).  But to recap, I think that China will grow in 2018, but substantially less rapidly than it did in 2017 as OBOR projects take production out of the country ( - remember that GDP only includes production within the borders of a country).  OBOR is clearly long term geopolitical and economic investment project, so it is expected that GDP would slow...GNP, on the other hand, will stay relatively robust.  Anyone who has been to China can attest to the fact that although investment is still high, it is clearly slowing as there is now a substantial amount of "infrastructure slack" in the economy ( - visible in terms of "ghost" trade and logistics inland ports, empty buildings and relatively empty new highways and fast speed trains out in the rural west).  And although consumption is now clearly on display in the major cities, I think that China's next push must be to modernize it's agricultural sector based in the rural areas, and that will not be easy.

As for India, 2017 was quite rocky (what with the monetary reforms and the unpopular new VAT tax), but as long as tinkering with major part of the macroeconomy do not continue under the Modi government, the prospects for an uptick in growth appear quite good.

Africa

The election of Cyril Ramaphosa as ANC Chair and therefore leader of the party, caused a relief rally
in late 2017, and I believe this will continue through 2018, with much more business friendly approaches making an appearance in South Africa and hopefully a more pragmatic approach to achieving the lifting of all boats through more sensible economic policies for the whole economy will start to bear fruit.

Investment Strategy

So given my macroeconomic views detailed above, what does this imply about investment strategy?  I have produced the cyclically adjusted price to earnings ratios (CAPE ratio) for all the countries discussed above in the figure below.  The data ends in November of 2017, so although we are missing one datapoint it is clear that the US has, since early 2016, had the highest CAPE.  That means that the US firms' stockmarket prices were highest compared to their earnings at this stage of the business cycle.  Then comes Japan, which is not far behind.  At the bottom of the CAPE rankings are UK and China, while the countries sandwiched in the middle are India and collectively the European countries. 


Source: http://shiller.barclays.com/SM/12/en/indices/static/historic-ratios.app
But what does that mean then?  I think what it means is that stocks in both China and the UK are valued at roughly half the amount that US and Japanese stocks are.  That in turn tends to suggest that i) if stockmarkets globally continue to climb, it is likely that those with lower CAPEs will grow faster than those with higher CAPEs; and ii) that if there were to be a pullback, the amount of the pullback is likely to be less in both the UK and China simply because those two markets have not climbed to nearly the same levels as have both the US and Japan.

So for an investment strategy based around the viewpoint expressed here, I would suggest:
i) underweight on US and Japanese stocks
ii) overweight on UK and Chinese stocks
iii) some weight in India and European stocks
iv) underweight on US government bond holdings
v) overweight on foreign bonds, particularly of those countries where China might want to substitute  holdings.
vi) overweight on other EM stocks, as these countries try to catch up with the phenomenal pick up in the US stockmarket.

And yes, I have already rearranged my own portfolio to put my proverbial money where my mouth is!


Friday, December 22, 2017

Why is the business cycle elongating?

First, let me wish all my Econoblog readers a Merry Christmas and a Happy New Year!!

Economists have traditionally put the business cycle at between 3 to 8 years long.  But of the last 4 business cycles 2 out of the last 4 have lasted longer than the 8 year limit that economists typically look at.  In fact counting this business cycle, which officially hits 10 years (or 120 months) in December 2017, 3 out of the last 5 business cycles have had periodicity longer than the 8 year economist "consensus" upper limit.

For those geeky enough to be interested in US business cycles see the table below which is lifted from the NBER website.  The longest expansion we have seen in the US economy was through the 1990s through until the tech stock bubble in 2001, which lasted a full 128 months, 8 months than where we are right now.
Source: NBER website

But this then begs another question.  What are the specific reasons as to why the current cycle would be elongated, and how persistent will these effects be in preventing us from entering the contractionary phase of the business cycle?  Well there are several reasons why I believe economists and economic commentators think that we might have an elongated cycle this time.  I will run through each of these reasons below, but to summarize these reason up front:

1.  We started the expansionary phase from a lower base, as the "great recession" of 2007-09 was more severe than all previous downturns with the exception of the "great depression";  

2.  Quantitative Easing (QE) has provided an additional stimulus which combined with the usual countercyclical fiscal policy, allowed the economy to achieve escape velocity, but QE is only now being unwound;

3.  The tax reform bill just passed by the Trump administration, plus the Infrastructure spending bill that the Trump administration has promised in the first half of 2018, will continue the fiscal stimulus for the economy through at least 2018, and possibly to the end of 2019; and

4.  That the "great moderation" which started in the 1980s, has seen a dramatically lowering in volatility for short term cycles in growth, but due to a couple of reasons, this cyclical volatility has transferred to longer cycles in growth which, for the moment implies that the usual business cycle frequency of 3 to 8 years quoted by economists is now incorrect.

So let's start with the first reason.  The main insight here comes from the Great depression, and the fact that when a macroeconomy experiences a really deep recession, where the financial sector is involved, the recovery will be slow and arduous.  The accompanying chart from an IMF publication shows this quite clearly.  The horizontal axis shows the number of quarters into the recession and the reaction of various economic variables (averaged across countries and across time). So for example, residential investment starts to recover after around 4 quarters for non-financial recessions, but for financial recessions that recovery starts 11 quarters after the beginning of the recession.  As the great recession was caused by both the housing market and the financial markets, the recovery pattern has clearly been slower than for other recent recessions in the US. This is also clearly seen in GDP growth itself, which is shown below.  The most recent recession is the first recession since the Great depression where the economy was recovering from a financial recession and it is clear from the rate of growth coming out of the recent recession that the economy has had difficulty growing above roughly a 2% rate.

Source: BEA and authors calcs
While the logic of this argument appears sound, there are a couple of things to notice about the nature of the reasoning here.  First, the fact that the great recession was a financial recession would tend to suggest that the business cycle elongation will be only relevant for this current recovery rather than for business cycles in general. If this reason is correct, then the macroeconomy should return to its usual 3-8 year cycle after the next recession.  Second, it also flies in the face of business cycle dating that we referenced above - the business cycle has definitely been getting longer, and has not remained within the usual 3-8 year periodicity that economists so often cite.

The second reason as to why the current business cycle will be elongated is monetary policy. The amount of stimulus provided by central banks has continued to rise albeit at a slower pace.  As the graph below shows, the US is now reversing it's massive QE program, and that is one of the reasons why rates are rising in the US relative to rates elsewhere.  If we look at the chart below, we can see that indeed Global QE is still rising, mostly thanks to the ECB, who have still not started to taper.  That in itself is a massive boost to financial companies around the world as central banks have brought large amounts of financial assets off the commercial bank balance sheets, thus freeing up capital to be lent elsewhere, and stabilizing balance sheets.  If we look at this in terms of the rate of change of QE globally, we come up with a different impression, which is given by the chart below ( - please ignore the forecasts of a research group which were made in 2015).  These liquidity injections clearly have largely dissipated for most central banks, but net injections are still continuing.as reversals have not yet been substantial enough to make an impact on the total, and some central banks are still continuing their QE buying programs.

Note that this reason would also only imply a temporary one-time elongation of the business cycle, and so doesn't explain why the most recent business cycles appear to have been on a elongating trend.

The third reason is due to the recent US fiscal stimulus in the form of the tax reform and the possible infrastructure package that President Trump has promised next year. This will affect the US, but does come with likely additional public debt implications, which will tend to crowd out investment and in normal circumstances would drive interest rates up.  But the tax reform essentially increases the return on US investment (purchase of plant, machinery and equipment), which will tend to increase private investment, thereby offsetting the crowding out effect.  So on balance, with the individual income tax reductions, these corporate tax changes should further stimulate the US economy, bolstering the monetary policy argument above. Once again, this is a one-time effect, and does not explain the lengthening of the business cycle.

The last reason why we might be seeing an elongation of the business cycle can be explained by recent research that I have been doing with Professor Andrew Hughes Hallett of George Mason University.  The empirical argument is shown in the figure below.

This analysis is called a "multiresolution decomposition" or MRD, and the technique essentially extracts the processes embedded within the series over different frequency ranges which are represented by the series d1 to d5 which are shown in the figure. We have 2 papers, the first of which showed statistically that the longer cycles embedded in real GDP growth (shown by d5 and d6 above (which relate to cyclical activity ranging from above 8 -16 years and from 16 - 32 years respectively) have become more volatile since the early 1980s, while the higher volatility cycles in real GDP (shown by d1 to d4, corresponding to cycles from 2 quarters to 8 years), have become less volatile [see below for academic references].

The second paper, which has been published as a discussion paper by the central bank of Finland (Suomen Pankki) [again see below for academic reference], goes through a lengthy analysis of the theoretical models typically used by macroeconomists to show the factors that could potentially cause this lengthening of the business cycle.  To cut a long story short, the factors that could be shifting volatility in the process that drive economic growth from shorter cycles to longer cycles turn out to be i) an increase in inflation aversion; and ii) a reduction in output stabilization. So let us look at each of these parameters in turn.

Has there been an increase in inflation aversion moving from the pre-mid-1980s period through to the post-mid-1980s period?  I would assert that yes, there has been, and this is due to the fact that many central banks instituted inflation targeting and if he could have done so, we know that ex Fed Chairman Ben Bernanke would have done so.  So has there been a reduction in output stabilization?  That is, has there been a reluctance to fully engage fiscal policy to it's maximum effect during downturns and to offset any rapid growth in the economy?  I think the evidence, once again, is that yes, we are seeing less output stabilization in US fiscal policy for certain, and perhaps a little more emphasis on stabilization by the Fed.  The net effect though would still be for less emphasis on output stabilization.  Now why do I assert that this is the case?  I think the evidence has been on show during the last week in the US.  As we know we are entering the final stages of the business cycle, the Trump administration has effectively announced a tax stimulus package which then will cause a spurt in growth as well as a one time elongation of the business cycle.  This tax reform package is definitely not output stabilization in the classic sense of counter-cyclical fiscal policy.

So note here that this fourth explanation would help to explain a permanent elongation of the business cycle since the mid-1980s.

But what about the markets in all of this?  One of the best visualizations I have seen relating to business cycles and the stock market came in a piece of research out of Goldman Sachs in late November this year (see below).


The figure shows that we are now approaching the 9th year of a bull market, with no signs of any correction coming.  This is not quite the record run yet, but it is fast approaching the 9.1 years of the 1920s bull market.

My own feeling about the financial markets is that we are beginning to move into "borrowed time", and that as soon as these one-time stimulus factors have passed, the downturn will happen. Whether that is in late-2018, 2019 or 2020 I am unsure.  But if there is one thing I am definitely sure of it is that the next downturn is coming sooner or later.

References

Crowley, P. and Hughes Hallett, A. (2015), "Great moderation or “Will o’ the Wisp”? A time–frequency decomposition of GDP for the US and UK", Journal of Macroeconomics, Vol 44, pp82-97.

Crowley, P. and Hughes Hallett, A. (2014), “Volatility transfers between cycles: A theory of why the "great moderation" was more mirage than moderation”, Bank of Finland Discussion Paper 24/2014.

Featured Post

Free Trade on Trial - What are the Lessons for Economists?

This election season in the US there has been an extraordinary and disturbing trend at work: vilifying free trade as a "job kille...

Popular Posts

Search This Blog