Showing posts with label business cycle. Show all posts

Wednesday, January 10, 2018

Happy New Year for 2018!! Economic outlook and investment strategy

Happy New Year to all my Econoblog readers, and readers through the syndication to Seeking Alpha. As usual, I will try and distill my "top down" macro views for prospects for 2018 in terms of economic growth, the stockmarket, and interest rates.

Backdrop

As we enter the 10th year since the last downturn, the global economy is living on borrowed time - and I mean that literally!  As I explored in my last Econoblog posting (see here), the business cycle is elongating, for either temporary or permanent reasons.  My own predilection is for a permanent elongation (mostly due to the findings from my own academic research agenda), but either way, an elongation is now occurring for this phase of the business cycle as we move into 2018.

So the real question is what will perform best as we move into the late stages of the business cycle expansion, and how to hedge the uncertainty of the coming downturn whenever it is. Well there are several different approaches one can take to answering this question, so I will first do a review of what I see are the prospects for the different regions of the world, and then focus in on what I think makes sense for my own investment strategy.

A quick aside. 2017 has been an exceptional year in the stockmarkets, and the performance of the major stockmarkets in the world has been positive almost everywhere. In the US, the S&P 500 was up 19.4%, the DJIA up 25.1% and the Nasdaq up an astounding 28.2%, while the 10 year US government bond yield is still under 3%.  But although the US performed well, many other countries outperformed the US.  The chart below shows the return of different stockmarkets (in US$ terms), and if we use the S&P 500 as probably the best overall barometer for the entire US stockmarkets, then the US is near the bottom of the list in terms of performance for 2017.
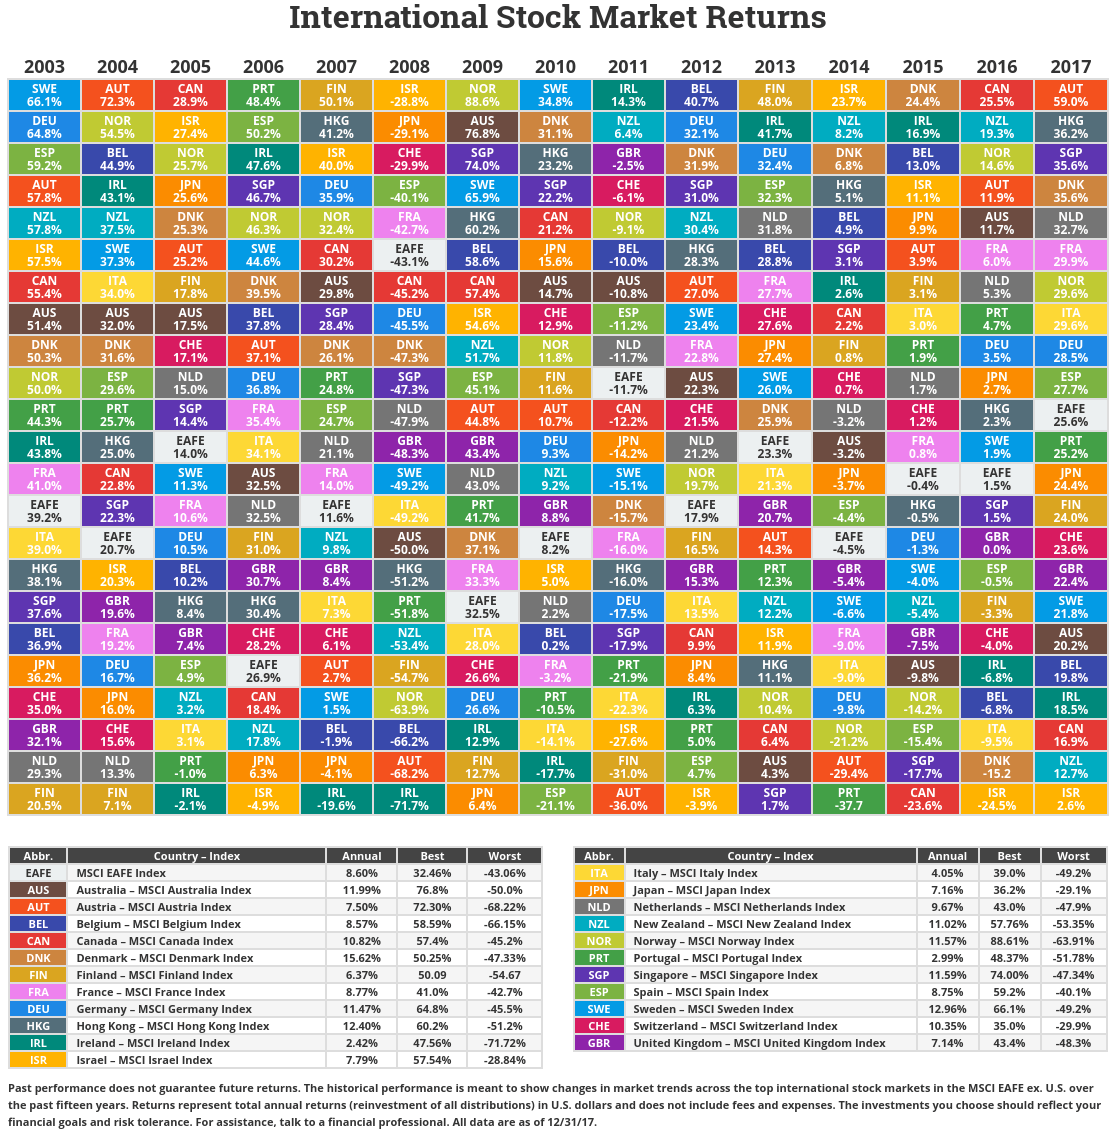
Novel Investor International Markets Returns Table
Source: Novel Investor

But this also doesn't consider other classes of assets, and the website Novel Investor once again has this covered with a chart that shows that emerging market stockmarkets outperformed all other classes of stocks.  This is due to the fact that emerging market stockmarkets have had a fairly tepid performance throughout this business cycle upswing, so in the late stages of the upswing in growth, obviously this will boost commodity prices for many things, which will allow emerging market stockmarkets to outperform.

Novel Investor Asset Class Returns TableSource: Novel Investor

But what of individual emerging markets?  Where performed the best?  Well once again, Novel investor has us covered here too.
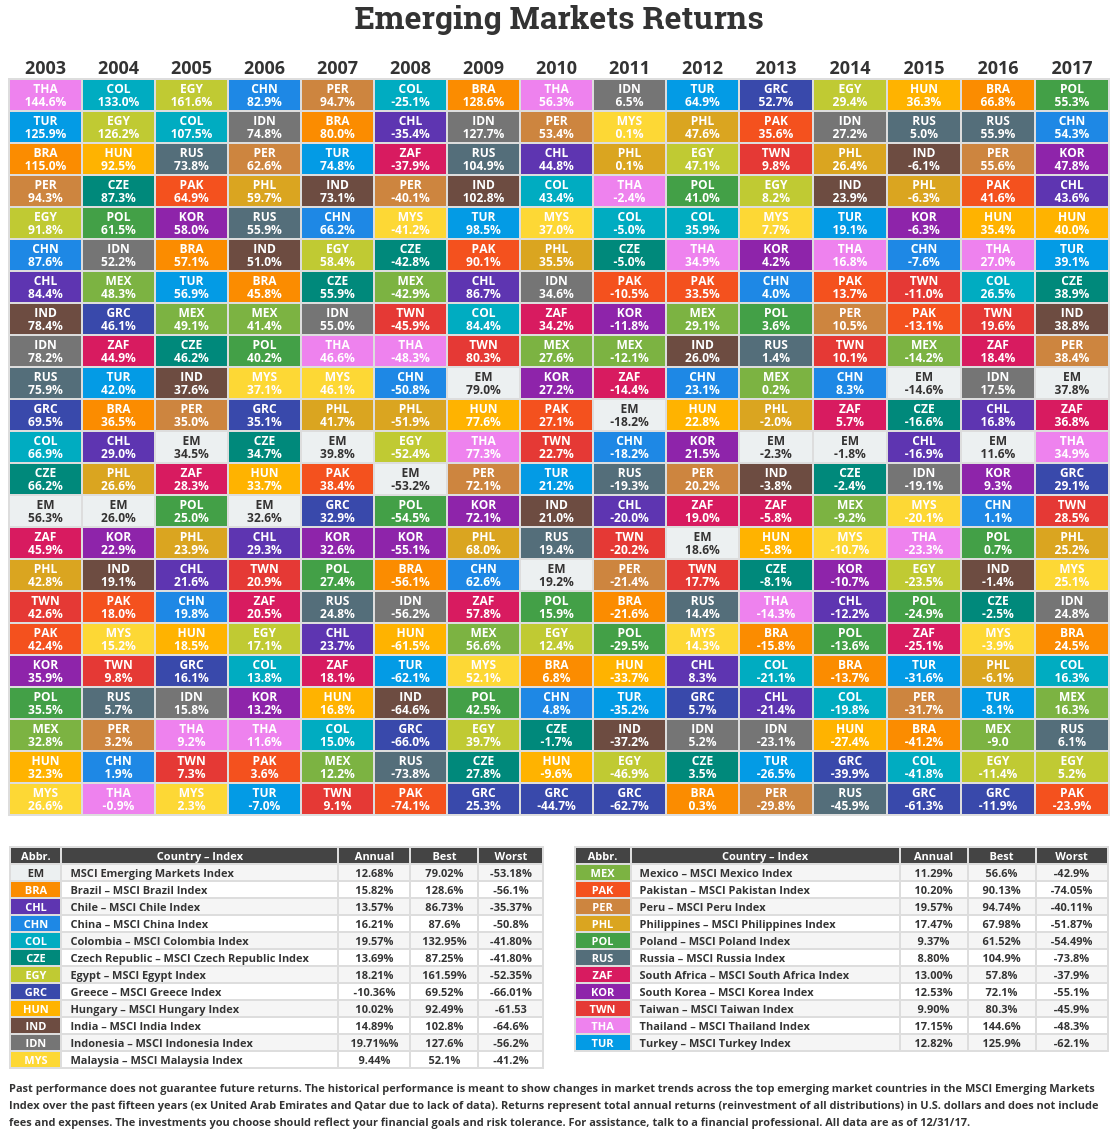
Novel Investor Asset Class Returns Table

Source: NovelInvestor.com

So Poland, China, South Korea and Hungary were the big winners for 2017.  And Pakistan, which several commentators said would perform very well in 2017, was the big loser.  And that really highlights a problem with emerging market economies and individual emerging markets - they are very volatile and it is really a fools game trying to pick which market will be the winner in any particular year.  But there again, that's why anyone interested in investing in emerging markets would be wise to buy an emerging market mutual fund rather than stocks in any individual country.

Back to my thoughts about 2018.  So with the backdrop of the current phase of the business cycle and the fact that US interest rates are likely to rise in 2018, let's look at each region in turn and then devise an economic outlook and investment position for 2018.

North America


The US has had a great run in 2017, but with rising rates, and an erratic President, with the good news for US corporations now delivered in terms of the tax reform, further progress with President Trump's agenda will be difficult.  The President will need cooperation from democrats if he is to pursue his plans to pass an infrastructure spending package, and the impasse on immigration doesn't seem to bode well for cooperation in that or in any other area for that matter.  So I can only conclude that most of the good news for stocks has already now been achieved, and there will be little more coming down the pipeline.  If there is more and I am wrong, then clearly the infrastructure and construction companies will do well.  Given the political uncertainty in the US surrounding the mid-term elections and the ongoing investigations together with rising interest rates and withdrawal of QE, I think the US will underperform compared to other parts of the developed world and certainly with respect to the emerging markets.

I think NAFTA will likely collapse in 2018, which will mean that Mexico is probably not a stable place to invest, but Canada will likely outperform both the US and Mexico, given that the US has made it clear that if NAFTA is terminated, then the US would still be open to falling back to the original CUFTA trade deal that was the precursor to NAFTA.  So in general, I think that Canadian stocks are a safer bet than US stocks for 2018 and should be bought on any signs of weakness.

The other factor that has had very little press so far this year is that yes, we have a new Chair of the Fed, Jay Powell.  As with all Fed Chairs, Jay is likely to have an early stumble or mishap in the job as he finds his feet.  That may unnerve the markets as well.  I would expect that maybe the FOMC might act too aggressively to increase rates than is necessary, or may "fall behind the curve" at some point.  Either way, there are clearly consequences for the stockmarkets here.

The US dollar is also a bit of a conundrum for 2018.  Rising interest rates usually portend a stronger currency, and that's what we have seen so far but with the protectionism proposed by the Trump administration and the possibility that the Chinese may no longer buy so many bonds, that in turn will have an uncertain effect on the currency.  As can be seen from the plot of the trade weighted US dollar, despite the recent depreciation, we are close to all time highs already.  Obviously from international economics that means that the markets have already discounted further rate rises, and are perhaps now looking for reasons not to push the US currency any higher.


Europe

European stockmarkets generally had a great year in 2017, and as QE continues in 2018, it is likely that this will continue at least until the second half of the year.  If you look at the performance of the European stockmarkets in recent years, they nearly all had downturns in 2014 and/or 2015, so they are basically still catching up with the US, and of course the banking sectors in the EU are still fragile but improving as time goes on.  The Mifid2 directive, which was supposed to come into force at the beginning of this year will likely (when implemented in March) increase transparency and efficiency in EU stockmarkets which will tend to increase confidence and spur greater stockmarket returns.

The two areas where there are significant risks are Brexit and Greece.  With Brexit, there is no certainty yet that a trade deal between the UK and the EU will be achieved before the exit date of March 2019.  Although Prime Minister Theresa May has successfully concluded the conditions of the breakup by agreeing to a hefty payment to the EU and safeguarding the right of EU nationals to remain in the UK after March 2019, this does not ensure that a trade deal will be struck in time.  The current policy of "gradual divergence" (see here) does not bode well for a consensus on any new trade deal as the EU does not see this as consistent with having a trade deal that would create a level playing field between the UK and the EU - it is seen as cherry-picking the areas where the UK would not want to diverge for fear of losing business, while having the right to diverge in other areas.  Also the Chancellor, Philip Hammond, who is much more in favor of a "soft" Brexit, has broached the idea of a new customs union with the EU (see here), but this would not allow the UK much independence when negotiating trade deals with other countries as the UK's hands would already be tied in relation to trade policy because of the EU customs union.   The second area of risk remains Greece.  Greece is now experiencing growth again, but the political situation is still not completely stable, as an elections must be called by October 2019, and the current government is unlikely to want to wait that long, so a general election is likely to be called in the second quarter of 2018.  The outcome of the election is likely to determine whether Greece continues to follow the path of fiscal consolidation insisted upon the rest of the EU, or a new government pushes the country in a different direction.

From an investment standpoint probably the Nordic countries are most insulated from these risks, although probably Central and Eastern Europe stockmarkets are still likely to be the most volatile and may yet again outperform the Western and Southern European member states.

Japan

The news from Japan has basically been good in 2017.  The efforts to stimulate the economy using QE appear to be now paying off, with economic growth now positive for the 7th consecutive quarter (see here), but mostly due to external factors rather than domestic growth ( - consumption was still in decline in the last quarter reported).  Nevertheless recent revisions to 3rd quarter GDP suggest that the economy was growing faster than previously thought, which allowed the stockmarket to remain buoyant, but it does mean that without the external demand stimulus and the continuing QE, the economy would likely have experienced only tepid growth.

The Japanese economy therefore does appear to have achieved "escape velocity" which means that deflation is now in the rear view mirror, despite the fact that inflation is still falling short of the Bank of Japan's inflation targets.  This should allow the Japanese stockmarket to make further gains in 2018.  In fact, if correct, a recent FT article (see here) suggests that the labor market is now in a state of severe shortage, which should allow wages to start to rise in a more sustained.  That, in turn, will boost the stockmarket.

Rest of Asia

My views on China are relatively well known after my recent presentation on OBOR (One Belt One Road).  But to recap, I think that China will grow in 2018, but substantially less rapidly than it did in 2017 as OBOR projects take production out of the country ( - remember that GDP only includes production within the borders of a country).  OBOR is clearly long term geopolitical and economic investment project, so it is expected that GDP would slow...GNP, on the other hand, will stay relatively robust.  Anyone who has been to China can attest to the fact that although investment is still high, it is clearly slowing as there is now a substantial amount of "infrastructure slack" in the economy ( - visible in terms of "ghost" trade and logistics inland ports, empty buildings and relatively empty new highways and fast speed trains out in the rural west).  And although consumption is now clearly on display in the major cities, I think that China's next push must be to modernize it's agricultural sector based in the rural areas, and that will not be easy.

As for India, 2017 was quite rocky (what with the monetary reforms and the unpopular new VAT tax), but as long as tinkering with major part of the macroeconomy do not continue under the Modi government, the prospects for an uptick in growth appear quite good.

Africa

The election of Cyril Ramaphosa as ANC Chair and therefore leader of the party, caused a relief rally
in late 2017, and I believe this will continue through 2018, with much more business friendly approaches making an appearance in South Africa and hopefully a more pragmatic approach to achieving the lifting of all boats through more sensible economic policies for the whole economy will start to bear fruit.

Investment Strategy

So given my macroeconomic views detailed above, what does this imply about investment strategy?  I have produced the cyclically adjusted price to earnings ratios (CAPE ratio) for all the countries discussed above in the figure below.  The data ends in November of 2017, so although we are missing one datapoint it is clear that the US has, since early 2016, had the highest CAPE.  That means that the US firms' stockmarket prices were highest compared to their earnings at this stage of the business cycle.  Then comes Japan, which is not far behind.  At the bottom of the CAPE rankings are UK and China, while the countries sandwiched in the middle are India and collectively the European countries. 


Source: http://shiller.barclays.com/SM/12/en/indices/static/historic-ratios.app
But what does that mean then?  I think what it means is that stocks in both China and the UK are valued at roughly half the amount that US and Japanese stocks are.  That in turn tends to suggest that i) if stockmarkets globally continue to climb, it is likely that those with lower CAPEs will grow faster than those with higher CAPEs; and ii) that if there were to be a pullback, the amount of the pullback is likely to be less in both the UK and China simply because those two markets have not climbed to nearly the same levels as have both the US and Japan.

So for an investment strategy based around the viewpoint expressed here, I would suggest:
i) underweight on US and Japanese stocks
ii) overweight on UK and Chinese stocks
iii) some weight in India and European stocks
iv) underweight on US government bond holdings
v) overweight on foreign bonds, particularly of those countries where China might want to substitute  holdings.
vi) overweight on other EM stocks, as these countries try to catch up with the phenomenal pick up in the US stockmarket.

And yes, I have already rearranged my own portfolio to put my proverbial money where my mouth is!


Friday, December 22, 2017

Why is the business cycle elongating?

First, let me wish all my Econoblog readers a Merry Christmas and a Happy New Year!!

Economists have traditionally put the business cycle at between 3 to 8 years long.  But of the last 4 business cycles 2 out of the last 4 have lasted longer than the 8 year limit that economists typically look at.  In fact counting this business cycle, which officially hits 10 years (or 120 months) in December 2017, 3 out of the last 5 business cycles have had periodicity longer than the 8 year economist "consensus" upper limit.

For those geeky enough to be interested in US business cycles see the table below which is lifted from the NBER website.  The longest expansion we have seen in the US economy was through the 1990s through until the tech stock bubble in 2001, which lasted a full 128 months, 8 months than where we are right now.
Source: NBER website

But this then begs another question.  What are the specific reasons as to why the current cycle would be elongated, and how persistent will these effects be in preventing us from entering the contractionary phase of the business cycle?  Well there are several reasons why I believe economists and economic commentators think that we might have an elongated cycle this time.  I will run through each of these reasons below, but to summarize these reason up front:

1.  We started the expansionary phase from a lower base, as the "great recession" of 2007-09 was more severe than all previous downturns with the exception of the "great depression";  

2.  Quantitative Easing (QE) has provided an additional stimulus which combined with the usual countercyclical fiscal policy, allowed the economy to achieve escape velocity, but QE is only now being unwound;

3.  The tax reform bill just passed by the Trump administration, plus the Infrastructure spending bill that the Trump administration has promised in the first half of 2018, will continue the fiscal stimulus for the economy through at least 2018, and possibly to the end of 2019; and

4.  That the "great moderation" which started in the 1980s, has seen a dramatically lowering in volatility for short term cycles in growth, but due to a couple of reasons, this cyclical volatility has transferred to longer cycles in growth which, for the moment implies that the usual business cycle frequency of 3 to 8 years quoted by economists is now incorrect.

So let's start with the first reason.  The main insight here comes from the Great depression, and the fact that when a macroeconomy experiences a really deep recession, where the financial sector is involved, the recovery will be slow and arduous.  The accompanying chart from an IMF publication shows this quite clearly.  The horizontal axis shows the number of quarters into the recession and the reaction of various economic variables (averaged across countries and across time). So for example, residential investment starts to recover after around 4 quarters for non-financial recessions, but for financial recessions that recovery starts 11 quarters after the beginning of the recession.  As the great recession was caused by both the housing market and the financial markets, the recovery pattern has clearly been slower than for other recent recessions in the US. This is also clearly seen in GDP growth itself, which is shown below.  The most recent recession is the first recession since the Great depression where the economy was recovering from a financial recession and it is clear from the rate of growth coming out of the recent recession that the economy has had difficulty growing above roughly a 2% rate.

Source: BEA and authors calcs
While the logic of this argument appears sound, there are a couple of things to notice about the nature of the reasoning here.  First, the fact that the great recession was a financial recession would tend to suggest that the business cycle elongation will be only relevant for this current recovery rather than for business cycles in general. If this reason is correct, then the macroeconomy should return to its usual 3-8 year cycle after the next recession.  Second, it also flies in the face of business cycle dating that we referenced above - the business cycle has definitely been getting longer, and has not remained within the usual 3-8 year periodicity that economists so often cite.

The second reason as to why the current business cycle will be elongated is monetary policy. The amount of stimulus provided by central banks has continued to rise albeit at a slower pace.  As the graph below shows, the US is now reversing it's massive QE program, and that is one of the reasons why rates are rising in the US relative to rates elsewhere.  If we look at the chart below, we can see that indeed Global QE is still rising, mostly thanks to the ECB, who have still not started to taper.  That in itself is a massive boost to financial companies around the world as central banks have brought large amounts of financial assets off the commercial bank balance sheets, thus freeing up capital to be lent elsewhere, and stabilizing balance sheets.  If we look at this in terms of the rate of change of QE globally, we come up with a different impression, which is given by the chart below ( - please ignore the forecasts of a research group which were made in 2015).  These liquidity injections clearly have largely dissipated for most central banks, but net injections are still continuing.as reversals have not yet been substantial enough to make an impact on the total, and some central banks are still continuing their QE buying programs.

Note that this reason would also only imply a temporary one-time elongation of the business cycle, and so doesn't explain why the most recent business cycles appear to have been on a elongating trend.

The third reason is due to the recent US fiscal stimulus in the form of the tax reform and the possible infrastructure package that President Trump has promised next year. This will affect the US, but does come with likely additional public debt implications, which will tend to crowd out investment and in normal circumstances would drive interest rates up.  But the tax reform essentially increases the return on US investment (purchase of plant, machinery and equipment), which will tend to increase private investment, thereby offsetting the crowding out effect.  So on balance, with the individual income tax reductions, these corporate tax changes should further stimulate the US economy, bolstering the monetary policy argument above. Once again, this is a one-time effect, and does not explain the lengthening of the business cycle.

The last reason why we might be seeing an elongation of the business cycle can be explained by recent research that I have been doing with Professor Andrew Hughes Hallett of George Mason University.  The empirical argument is shown in the figure below.

This analysis is called a "multiresolution decomposition" or MRD, and the technique essentially extracts the processes embedded within the series over different frequency ranges which are represented by the series d1 to d5 which are shown in the figure. We have 2 papers, the first of which showed statistically that the longer cycles embedded in real GDP growth (shown by d5 and d6 above (which relate to cyclical activity ranging from above 8 -16 years and from 16 - 32 years respectively) have become more volatile since the early 1980s, while the higher volatility cycles in real GDP (shown by d1 to d4, corresponding to cycles from 2 quarters to 8 years), have become less volatile [see below for academic references].

The second paper, which has been published as a discussion paper by the central bank of Finland (Suomen Pankki) [again see below for academic reference], goes through a lengthy analysis of the theoretical models typically used by macroeconomists to show the factors that could potentially cause this lengthening of the business cycle.  To cut a long story short, the factors that could be shifting volatility in the process that drive economic growth from shorter cycles to longer cycles turn out to be i) an increase in inflation aversion; and ii) a reduction in output stabilization. So let us look at each of these parameters in turn.

Has there been an increase in inflation aversion moving from the pre-mid-1980s period through to the post-mid-1980s period?  I would assert that yes, there has been, and this is due to the fact that many central banks instituted inflation targeting and if he could have done so, we know that ex Fed Chairman Ben Bernanke would have done so.  So has there been a reduction in output stabilization?  That is, has there been a reluctance to fully engage fiscal policy to it's maximum effect during downturns and to offset any rapid growth in the economy?  I think the evidence, once again, is that yes, we are seeing less output stabilization in US fiscal policy for certain, and perhaps a little more emphasis on stabilization by the Fed.  The net effect though would still be for less emphasis on output stabilization.  Now why do I assert that this is the case?  I think the evidence has been on show during the last week in the US.  As we know we are entering the final stages of the business cycle, the Trump administration has effectively announced a tax stimulus package which then will cause a spurt in growth as well as a one time elongation of the business cycle.  This tax reform package is definitely not output stabilization in the classic sense of counter-cyclical fiscal policy.

So note here that this fourth explanation would help to explain a permanent elongation of the business cycle since the mid-1980s.

But what about the markets in all of this?  One of the best visualizations I have seen relating to business cycles and the stock market came in a piece of research out of Goldman Sachs in late November this year (see below).


The figure shows that we are now approaching the 9th year of a bull market, with no signs of any correction coming.  This is not quite the record run yet, but it is fast approaching the 9.1 years of the 1920s bull market.

My own feeling about the financial markets is that we are beginning to move into "borrowed time", and that as soon as these one-time stimulus factors have passed, the downturn will happen. Whether that is in late-2018, 2019 or 2020 I am unsure.  But if there is one thing I am definitely sure of it is that the next downturn is coming sooner or later.

References

Crowley, P. and Hughes Hallett, A. (2015), "Great moderation or “Will o’ the Wisp”? A time–frequency decomposition of GDP for the US and UK", Journal of Macroeconomics, Vol 44, pp82-97.

Crowley, P. and Hughes Hallett, A. (2014), “Volatility transfers between cycles: A theory of why the "great moderation" was more mirage than moderation”, Bank of Finland Discussion Paper 24/2014.

Monday, November 3, 2014

What can wavelets tell us about long term US economic growth?

In this blog I always try and emphasize cyclical features of macroeconomic growth, as that is my main research interest right now. Given the extraordinary events taking place in the world of monetary policy in recent years, an important question to look at is where the long run US economic growth rate is going, as the argument has been made that the more fractured US labor market could lead to weaker economic growth going forward as US consumers are less willing to spend as they were before the great recession .

First, if you look at US economic growth, there has been a lot of talk about a decline in the long term US growth rate trend. What do I mean by this?  Recent (excellent) research by some economists at Fulcrum Investments highlighted in an FT article by Gavyn Davies (see here) used something called a "Dynamic Factor Model".  This research incorporated some tweaks in the overall model to allow it to "detect" where the long run US economic growth rate is headed.  Their results clearly show that long term US economic growth (and growth in other major developed economies) is heading downwards.  The figure below from their paper (which you can find here) shows the downward trend that they obtain for the long run US economic growth rate. In their paper the authors go on to repeat this analysis for the other major developed economies with very similar results.

Source: Antolin-Diaz, Dreschel and Petrella (2014), p21

Above the red line plots their long run growth rate, with the blue dotted lines showing 5 and 10 percent confidence intervals.  The black much more cyclical line shows the Congressional Budget Office's measure of the growth in potential output ( - the growth in the maximum output of the economy if all factors of production were employed).

On the face of it, the red line showing their measure of estimated growth looks pretty bad - it appears to move downwards over the 55 years plotted here.  But there are two points to bear in mind here though.

First, this measure does not use the official definition of economic growth, which is percentage change in real GDP per capita, as it is measured here as percentage change in real GDP.  In fact most economists do not either, as getting population estimates by quarter is extremely difficult and even if you do, they are only estimates as we only really take a proper guage on the US population every census year.  In other words, the figure above doesn't account for the change in population growth. This is important, as in all developed countries there has been a decline in the population growth rate, so some of this fall in the percentage change in real GDP would be expected.  Now the authors do attribute some of the fall in the growth rate to the fall in population growth, so this is not a fault with their analysis, but rather something that one would be expect to be reflected in the figure above, thus tending to support a fall in the long term growth rate.

Second, I would argue that their definition of "long term" is not correct.  To me, long term means something that is measured over several business cycles, not just over one business cycle.  Just looking at the graph above, I would argue that for the period 1970 to 2000 their long term measure of the economic growth rate was actually pretty stable, but that their measure clearly turns downwards well after 2000. So their measure really drops decisively below 3% only in 2004 or thereabouts, only 10 years ago, and therefore not even a complete business cycle ago. To my way of thinking that is not a change in the long term growth rate, as it has only happened over the last business cycle.  Why does this matter?  Well it could be (as we all know from the Reinhart and Rogoff research) that the recovery from the last recession was weak because the last recession was caused by a systemic banking failure - something that takes a lot longer to recover from than a "regular" recession.

Often it is good to get a robustness check on the results from doing an exercise like this by looking at what alternative methodologies reveal about the fluctuations in economic growth that the US has experienced. So here I introduce another approach known as wavelet analysis.  This type of analysis operates in what scientists call the "time-frequency" domain, as it assumes a certain degree of (regular or irregular) cyclicality.

So let's first start with what wavelet analysis does.  It basically takes the data and extracts cycles that can be detected by the technique over different ranges of frequencies. This is done in certain preset ranges, and these ranges are dyadic ( - they increase in terms of powers of 2).  So for example the most basic cycles in a quarterly data series can be extracted at the 2 to 4 quarter cycle, then at a 4 to 8 quarter cycle, an 8 to 16 quarter cycle etc. When you run this type of wavelet analysis ( - technically it's called multiple overlap discrete wavelet analysis), you have to specify the maximum length of cycle you want to extract.  Here I specify a 16 year cycle to be the maximum cycle, so that means that we have 5 series of what are called "crystals" which include the different ranges of cycles up to a 16 year cycle. Then anything left over after cycles up to 16 years long are extracted, is also put into what is called the "wavelet smooth".  It contains any trend in the series plus any cycles in the data that can be detected that are longer than 16 years in length.

So what does this look like for US economic growth?

Source: Calculations by author
In the chart above I have broken down the fluctuations in US economic growth by cycle range, so lyd1 (the dark blue line) represents 2 to 4 quarter fluctuations in growth, lyd2 (the bright red line) represents 1 to 2 year cycles in growth etc.  The light brown line which is labelled lys5 represents everything left in the growth series after all the other cycles have been extracted, so it contains cycles longer than a 16 year duration and any trend left in the series. Following the wavelet literature, I will call this variable (lys5) the "smooth".

What I find is very different from the Fulcrum Investment research. It is clear that from around the late-1960s onwards the growth rate has fallen to a lower level than it was prior to this date. But from around 1983 we see another phenomena emerging in the data - that of the so-called "great moderation", which saw high frequency fluctuations (lyd1, lyd2 and lyd3) dampened down, but at the same time a more vigorous longer term cycle emerging, particularly in the "smooth". In a paper with Andrew Hughes Hallett (available here) we show that in fact there was likely volatility transfer from this more high frequency (shorter) cycles to the low frequency (longer) cycles. I will write more about this paper and it's implications in a future blog.

But what is clear is that the longer term trends shown by the wavelet smooth do not indicate a significant decline in the long term economic growth rate. In fact, quite the opposite: it shows that i) the longer term smooth has been falling for cyclical reasons, as it has rebounded nicely since the great recession, but also ii) the longer term trend (also captured by the smooth) is in fact moving upwards quite rapidly, signifying that the economy is still on a long cycle upswing right now. In fact it may indicate that there is a longer cycle in growth lurking in the data.

Of course which methodology is right will affect a whole lot of other variables in the economy - such as the stockmarket, the bond market, incomes and expenditures.

So which method is right?  Both methods have their advantages, but both also have disadvantages and statistical flaws. Probably the honest answer is that only time will tell!  

Sunday, September 4, 2011

Even without a double dip, should we feel bad about the US economy?

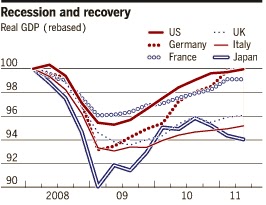
The grim outlook outlined by Martin Wolf in his FT column this week was a stark reminder that economic measurements, while being constructs that usually measure what we want them to, can sometimes not reveal what we want them to reveal.  The example of our definition of a recession is a good example and the one used by Wolf in his column.  By the measures used by the business cycle dating committee of the National Bureau for Economic Research (NBER), the recession ended in June 2009, and yet here we are 24 months later still at real output levels that are below those of the peak of the previous cycle.  The graphic from Martin Wolf's article is reproduced on the left, and shows that US real GDP is still slightly below it's peak in late 2007 and that other countries such as Japan, Italy, the UK and France are also still languishing at output levels way below their peak in the second quarter of 2007.

The fact that the vast majority of the American general public believe that the US economy is still in recession.  According to a CNN poll (see here) only 18% of Americans believe that we are not in recession right now, so this also does not accord with the way that economists measure recessions, and suggests that we might need to review this, or at least re-categorise the phases of the business cycle!


So what should be our measure of a "recession"?  I have heard many commentators say that although we are still not officially in a recession, it sure still feels like one, particularly when unemployment is still high and there are still calls for economic stimulus like the one heard only today from Fed Chicago District President Charles Evans (see here).  But given what has happened in Japan and what appears to be happening in some other developed countries, maybe we should reconsider our definition of recession as a cyclical downturn and recovery up to the point where we surpass the level of real GDP achieved at the peak of the previous boom. In fact with a growing population even this is unsatisfactory because 4 years ago in 2007 the population was smaller than it is today in nearly all of these countries ( - the exception perhaps being Japan) so if we measure output on the basis of output per head of population (or per capita), we would take longer than indicated in the graph above to get to the same level of output per capita so we would be calling the recession over before it really ended. In fact, to be frank I am in favor of changing our definition of a recession because the current measure only focuses on the downturn and does not focus on what happens afterwards - plainly Japan's experience in the 1990s plus our own recent experience suggest that not all downturns are followed by rapid upturns.


All this is even more relevant given the release of the employment statistics on Friday - and the New York Times had a great graph in it's economics top story on the release - an update of the graph originally used by Nancy Polosi to justify the stimulus in the heady first 100 days of the Obama administration back in 2009.  The frightening thing about the graph on the left is that it most clearly shows why this current downturn has been much different from previous downturns. The previous downturn to be matched against the Great Depression was the downturn in the early 1980s where employment fell by 3% from the peak of employment. This last recession caused job losses for way longer than the other recessions ( - in the early 1980s the job losses started turning around after 15 months whereas it took 26 months in this downturn), and way bigger than other recent recessions (over a 6% fall in employment).  The big picture shows that we have only managed to claw back 1% of the loss in jobs, despite economic stimulus and the Fed pumping credit and money into the economy.

I think a much more serious problem is another quite different story that the New York Times (august newspaper though it is) does not bring out in its reporting. If you look at the recessions of the 1970s, 80s and 90s and then the 2 recessions of the 00s, it seems clear to me that the US labor market is much less able to cope with recessions than it used to be - the recovery times seem to be longer and much more drawn out than they were even 20 years ago. To me this implies that there is some very serious changes going on - some of it structural, but I think something must be also be going on in terms of reluctance to hire - for example do companies delay hiring much longer than they used to, asking their current employees to do more overtime for a longer period of time before they decide to bite the bullet?  I'm not sure we know the answers to these questions yet, but clearly things are changing for US workers, and changing fast!  A pretty grim interpretation for the reasons for this are also given today by Robert Reich in the New York Times and although I don't go along with everything he says, I do agree that we need to focus on education, but I would also add that the US really also needs to focus on marketing itself to the rest of the world - countries that sell products to the developing countries (where the economic growth is right now) is one of the best ways to help expand our economy.

So to answer the question I pose for this blog, the response is clearly a resounding "No"! But for all the problems with the labor market ( - and given that it's really no surprise that Obama recently chose a Labor economist, Alan B. Krueger, to head up his economic team), the US has a lot going for it. It has some of the most dynamic companies in the world, and it is far ahead of most countries in the area of technology - but these advantages will narrow compared to Europe and Asia if the US does not focus on what leads to these advantages - education! I think what the US is essentially finding out is that although the military gave you economic power back during the cold war, spending a lot on military does not give you that advantage now. Countries that have focused more on education over the last 20 years (e.g. Finland, Germany, South Korea etc) are now doing very well thank you - countries that have not grown as fast.

What should be done then? I think a good start would be to redefine what a recession is, re-prioritize government spending towards education and away from the military, and to set up some kind of corporate international opportunities bureau which would list foreign opportunities and so US companies would be more aware and able to more easily grasp new overseas opportunities.  

Monday, June 13, 2011

Is a “Perfect Storm” heading our way?


The NYU economics professor, Nouriel Roubini just went on record in Singapore a few days ago about his long term prediction for world growth – and it wasn’t wonderful!  According to Bloomberg reporters he said that there was roughly a third chance of a perfect storm in 2013, where China slows down significantly because of lack of consumption and the unwinding of the real estate bubble there, the US also struggles to break free from its current headwinds of mounting debt and the housing malaise to return to historical levels of economic growth and the EU finds itself revisiting the PIGS (Portugal, Ireland, Greece and Spain) debt problems time and time again which slows that continent down as crowding out occurs from increases in interest rates.  According to Roubini by that time Japan would also have exhausted the extra fiscal stimulus given to the economy after the Tsunami from earlier this year, which adds the icing to a cake that clearly has refused to rise to the occasion. 

So what are the other two-thirds of Roubini's probabilities?  The second scenario with a weighting of roughly a third is a resumption to more usual levels of growth is one of them – clearly a soft landing in China, an upturn in growth in the US and better news from Europe plus a more permanent boost in growth in Japan could all combine to move things along faster than the pessimists expect.  And the third scenario with a weighting of a third again is an intermediate “anemic but OK” growth scenario where the factors in the “perfect storm” scenario are much less severe. 

Forecasting the global economy is, I would assert, harder than forecasting the weather.  At least with the weather you know there are going to be seasons – with the economy you don’t have any idea about when these “seasons” are going to occur. There is the “business cycle” of course, but the consensus for the length of the business cycle is anywhere between 3 and now 10 years.  Once you are 3 years beyond the end of the last recession (which ended in June 2009) which means we’re at June 2012, then it’s anyone’s guess when the next recession will occur. At the other extreme we’re pretty sure that something will happen by 2019, as we have never had a period of more than 10 years of uninterrupted economic growth in the US. 
If we look at the gap between recessions though, it has grown since the Second World War, and so the next recession is more likely to be later, rather than earlier. Given this, I would place less probability on Roubini’s “perfect storm” than the other two scenarios he came up with.  Also the rosy scenario is a little too “rosy” for my liking, in that not all policymakers get it right, and particularly in both China and Japan there is not much of a record of getting the correct mix of policies to really optimize economic growth, plus we now know that there is not a lot that policymakers can do once a bubble has really built up in an economy, so the Chinese might really have difficulties dealing with the aftermath of a popping of their property bubble.

So I would disagree with Professor Roubini’s main forecast, which is of a “perfect storm” brewing for 2013, and would predict that we are much more likely to see problems in one part of the world and growth in other parts over the next few years, but that the “perfect storm” in the form of the next recession is some way down the road, and rather unlikely, mainly because of business and growth cycle factors in 2013. My most likely scenario would consist of more of a divergence in growth around the world, which is not to say that I don't believe in an international business cycle, but more because each region of the world has a different focus and different views about the effectiveness of government policies. These perceptions, I believe, in and of themselves can produce different outcomes.
So a more interesting question from an investment standpoint is where there is most potential for a resumption in economic growth.  Although policymakers do not determine economic growth rates, they do, in my view, have a significant impact on setting the appropriate environment for growth to occur. The developing economies in the form of the emerging markets certainly have the most to gain, but if the US gets this mix of fiscal rectitude and continued modest monetary stimulus from the Fed right, then it too will also benefit. Non euro area European countries still have extremely bright prospects and of course the euro area, if it bites the bullet and develops a Euro area bond or decides to let Greece go, could also benefit. I, like several other commentators, am now bearish on China as their economic problems appear to presage a bursting bubble, and Japan, as I have already stated in this blog, might just be the biggest surprise of them all if they can only get their politicians to act sensibly.

Featured Post

Free Trade on Trial - What are the Lessons for Economists?

This election season in the US there has been an extraordinary and disturbing trend at work: vilifying free trade as a "job kille...

Popular Posts

Search This Blog